Karenia brevis, a toxic dinoflagellate alga, blooms off Florida’s southwest Florida coast almost annually. These algal blooms, colloquially referred to as red tides, can result in significant socioeconomic impacts through disruption to tourism, impacts to water dependent businesses and activities, and human health concerns. This is because K. brevis produces a potent neurotoxin called brevetoxin. Brevetoxin accumulates in shellfish and may cause neurologic shellfish poisoning (NSP) if contaminated seafood is consumed. Shellfish harvesting closures protect human health but can lead to economic losses for impacted aquaculture operations. Brevetoxins also become aerosolized when cells break open, and release toxins into the air where they are transported by winds. Aerosolized toxins can result in respiratory irritation, and for people with severe or chronic respiratory conditions, such as emphysema or asthma, aerosolized brevetoxins can cause serious illness. Brevetoxins also cause fish and wildlife mortalities, and disrupt ecosystem function, causing negative impacts to water dependent industries and ecotourism that rely on healthy coastal ecosystems.
One of the more frequently asked questions when southwest Florida experiences a major red tide event is “Is this the worst bloom ever?”
. Florida is a state whose population is always growing and changing and that certainly affects how people perceive impact. Someone who has only lived in Florida a few years is naturally going to have very different experiences with red tide than someone who has lived here 50 years. But that’s not the only complicating factor. The answer to this question is dependent on what factors you consider including bloom duration, intensity, spatial extent, degree of respiratory irritation, fish kills, etc., etc. These factors, along with inconsistent data collection across time and space, complicates bloom comparison, but this type of information is needed to help managers and decision makers evaluate the severity of blooms and develop mechanisms to respond and mitigate bloom impacts. To that end, a recent (2022) paper by Stumpf et al., discusses the development of two red tide indices; a multi-decadal K. brevis bloom severity index (BSI) to quantify the severity of blooms through time and a respiratory irritation impact (RI) index to quantify toxin exposure, also through time.
| What types of information can be gleaned from this study? | |
|---|---|
| Bloom Severity Index (BSI) – monthly & annual | • Bloom intensity • Extent and persistence of blooms • Patchiness of blooms |
| Respiratory Irritation Impact (RI) index – monthly & annual | • Magnitude of RI impact caused by K. brevis blooms • Persistence of respiratory irritation • Beach specific respiratory irritation |
| Bloom & Respiratory Irritation Seasonality | |
| Relationships among Karenia occurrence, respiratory irritation, and wind direction | |
| Socioeconomic considerations |
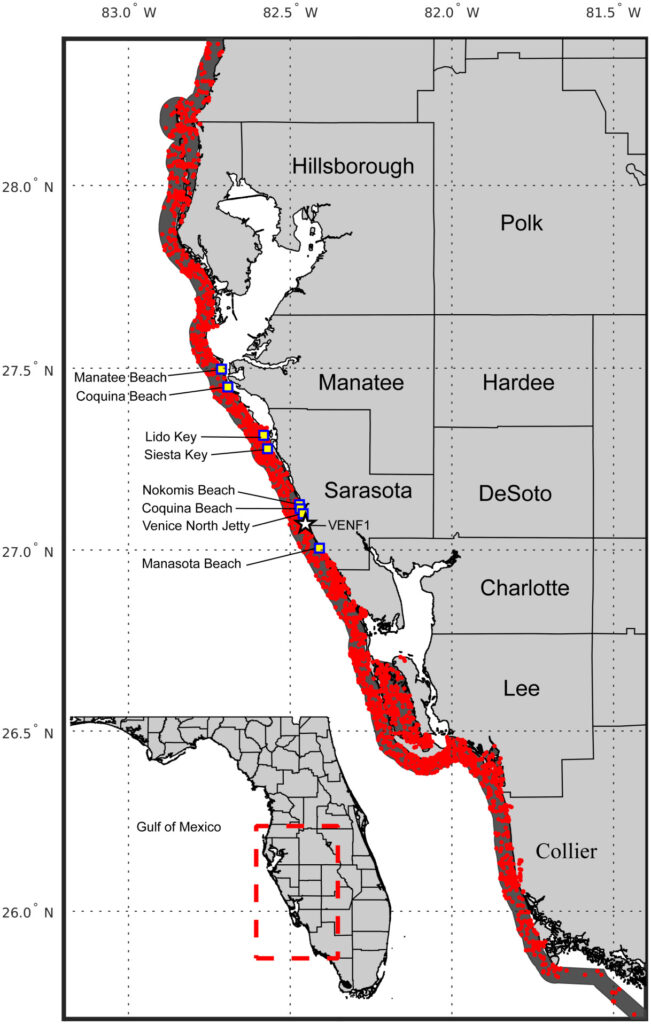
Study area with cell count samples collected between 1953-2019 within 5 km of coast (red dots) and 2007-2019 respiratory irritation monitoring locations (boxes) shown. Stumpf et al. 2021
The BSI characterizes K. brevis blooms in terms of spatial extent, duration, and cell concentrations and is presented on a scale from 0-10. The study authors obtained red tide cell count data from the Florida Fish and Wildlife Conservation Commission, Fish and Wildlife Institute (FWC-FWRI) Harmful Algal Bloom Monitoring Database, over the period 1953-2019. The index included cell count data from all water depths, within 5 km (3 miles) of the coast from Collier County through Pinellas County. Each cell count was binned by 0.2 degrees latitude and then assigned one of five cell concentration categories:
- absent to <5,000 cells/L,
- >5,000 to 50,000 cells/L,
- >50,000 to 100,000 cells/L,
- >100,000 to 1,000,000 cells/L, and
- >1,000,000 cells/L.
The concentration categories used in this study correspond to those used by the state of Florida. The data was also analyzed and normalized to produce monthly and annual BSIs based on concentrations greater than 5,000 cells/L. Shellfish harvesting is prohibited when cell counts exceed 5,000 cells/L, making it a good indicator of bloom presence.
The RI index relied on the Beach Conditions Reporting System (BCRS), maintained by Mote Marine Laboratory. BCRS captures respiratory irritation reports recorded by trained volunteers and beach lifeguards. The BCRS was started in Sarasota and Manatee counties in 2006 and 2007 respectively. Though the program has expanded to include beaches in other counties, this study was limited to the original two counties where the most robust data is available. Respiratory irritation reports provide a good proxy for brevetoxin aerosol impact. Volunteers and lifeguards report in four categories: none (i.e., no respiratory impact), slight, moderate, or high (severe) respiratory irritation. The RI index was developed into monthly, annual, and beach specific indices using a procedure equivalent to the BSI. The authors further analyzed the relationship between bloom severity and prevailing winds. Onshore winds are widely known for bringing aerosolized toxins onto the beach during blooms.
So, what can we take away from all of this? Well, K. brevis blooms typically make landfall between Sanibel Island and the mouth of Tampa Bay in August or September and terminate by late winter. Blooms migrate and expand via north or south movements, with net southernly movement. Blooms are near annual, and similar seasonal and spatial distribution is found regardless of whether cell counts occur at concentrations that define a bloom (> 5,000 cells/L) or cell concentrations that exceed 100,000 cells/L. Prior to 1994, monitoring efforts were mostly event-driven, in reaction to blooms where impacts were being directly felt by residents. As a result, blooms that were perhaps less severe/impactful to residents are possibly underreported.
If we stick to 1994 and later, after implementation of more uniformly robust monitoring efforts, the 2002 bloom was the most severe bloom, in terms of extent and duration of bloom presence based on an annual BSI, followed by 1995, 2001, and 2016. If we based our criteria on potential for respiratory impact (cell counts >50,000 /L), 2001 would be the most severe bloom year. But if we wanted to know what years the most intense blooms occurred, those with the greatest potential for severe respiratory impacts, and other impacts, such as fish kills (>1,000,000 cells/L), then that would be 2018, followed by 1994, 1995, and 2012.
We can now zoom into monthly BSI for a look at potential intense short-term impacts. In this case, in Feb 2016, nearly all the latitudinal bins in southwest Florida had bloom concentrations >100,000 cells/L. And although not the most severe in terms of extent and persistence, from June through November, the 2018 bloom, had a remarkably intense period (>1,000,000 cells/L).
The degree of RI impact generally corresponds with the size and intensity of the BSI; however, offshore winds can significantly suppress respiratory irritation. The influence of offshore winds speaks to the significance of possible underreporting prior to 1994. In terms of respiratory irritation impact, the most significant year occurred in 2018. Three of the four greatest months for respiratory irritation impact also occurred in 2018.
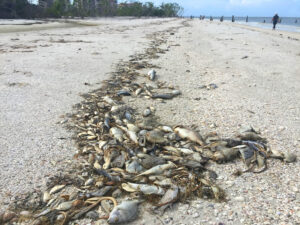
Dead fish wash ashore at Ft. Myers Beach during a red tide bloom. JillianCainPhotography/Shutterstock.com
There are far more details to be gleaned from this study’s methods and results than could ever possibly be captured here. But fortunately for those who wish to take a deep dive, the open access paper is available online. So going back to “Is this the worst bloom ever?”
question, it is still complicated, but at least now we do have a uniform way to answer this question for many important red tide characteristics. But this study doesn’t just help to answer the worst bloom question. Moving forward, these indices applied to an active bloom can lead to a better assessment of risk, in a similar fashion to how a heat index or an air quality index are used now.
Further, knowing what the impacts are from season to season has the potential to assist state agencies and local governments direct resources during and after blooms. Although blooms are patchy in nature, findings show that over the course of a season, blooms may impact a significant portion of the study region. As a result, regionalization of response efforts, removal of dead fish as an example, could be an optimal management strategy. These findings also bolster the need for a communication approach that is in place by late summer and one that extends throughout the life cycle of a bloom. These indices add a new component for assessing socioeconomic impacts. And finally, from a research perspective, results can aid models moving forward to advance our understanding of bloom variability which may lead to additional mitigation strategies.
It should also be noted, the approach used in this study could be applied to other blooms and other locations as long as sufficient monitoring data exists.
Citation:
Stumpf RP, Li Y, Kirkpatrick B, Litaker RW, Hubbard KA, Currier RD, Harrison, KK, and Tomlinson, MC. (2022). Quantifying Karenia brevis bloom severity and respiratory irritation impact along the shoreline of Southwest Florida. PLoS ONE 17(1): e0260755. https://doi.org/10.1371/journal.pone.0260755