Cyanobacteria, also known as blue-green algae, are a group of microorganisms that live in aquatic environments throughout the world. Some types of cyanobacteria are known to produce a variety of toxins that may cause harm and sometimes death to fish, wildlife, domestic animal, and rarely, humans.
Several studies have indicated that cyanobacterial harmful algal blooms (cyanoHABs) have increased in frequency, extent, and magnitude, globally over the last several decades. However, data are not available to quantify these metrics at regular intervals and across wide geographic scales. The lack of this information poses future risk to the environment and public health.
To inform monitoring priorities and management decisions, timely assessment methods are needed for regions experiencing cyanoHABs, as well as those where blooms are likely to occur in the future. To that end, a recently published paper (2022) by Schaeffer et al., quantified the spatial extent of cyanoHABs using satellites from the European Space Agency (ESA).
This study provides the first assessment of cyanoHAB spatial extent across the continental United States at geographic scales relevant to states and local agencies for making management decisions. There’s a huge amount of information to be gleaned here and I will only gloss over some it. To learn more, you can access the full research paper here.
| What types of information can be gleaned from this study? | |
|---|---|
| Spatial extent of satellite detected cyanoHABs at national-, regional-, state-, and lake-scales | • Monthly, annually & across satellite mission periods (2017-2020 and 2008-2011) |
| Short-term changes in spatial extent of at national-, regional-, state-scales | • Magnitude of change • Validation of robustness |
| Highlights from the study findings: |
|---|
| Cyanobacterial spatial extent changes were dependent on spatial and temporal scales considered |
| There was a strong national increase in cyanoHAB spatial extent during 2017-2020 but no universal trend during 2008-2011 |
| There was a moderate South and Southeast regional increase in cyanoHAB spatial extent during 2017-2020 but not during 2008-2011 |
| Twelve states had strong or moderate increases in cyanoHAB spatial extent during 2017-2020, whereas only one state had a moderate increase during 2008-2011 |
| A decrease or lack of change in cyanoHAB spatial extent did not necessarily correlate to an absence of cyanoHAB issues. |
| At the lake-scale, the number of lakes exhibiting strong spatial extent increased over both time periods |
The focus of this study was lakes and reservoirs greater than one hectare in size, that met additional study criteria (hereby referred to as resolvable lakes). The Great Lakes were excluded from this study because other programs already focus on them.
The satellites sensors used in this study were the MEdium Resolution Imaging Spectrometer (MERIS) onboard Envisat (2008-2012) and the Ocean and Land Colour Instrument (OLCI) onboard Sentinel-3 (2017-2020).
CyanoHAB spatial extent was determined monthly, annually, and across 4-year time periods, via a cyanobacteria index (CIcyano) algorithm, and at national-, regional-, state-, and individual lake-scales. At national-, regional-, and state-scales, trend analysis was also performed to assess short-term temporal changes in cyanoHAB spatial extent. Finally, robustness of the short-term change analysis was evaluated.
Though findings below are presented for both time periods, graphics only cover the later period from 2017-2020 for space’s sake. Equivalent 2008-2011 graphics can be accessed via the supplemental information link provided in the full paper.
2,192 lakes were resolvable via the imagery from the two satellites and included in the analyses. The resolvable water area varied over time due to missing data masked by clouds, snow, and ice as well as excluded data along the land/water interface. All the contiguous continental states, with the exceptions of Delaware and West Virginia contained resolvable lakes and were included in the study. Minnesota contained the most at 393 lakes and Connecticut the least with 3 lakes (Figure 1).
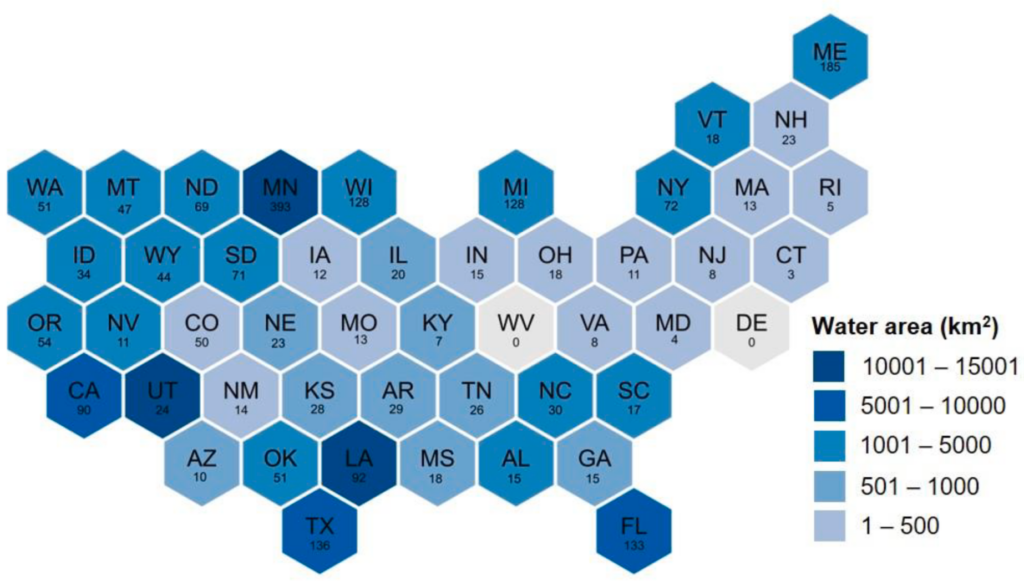
Figure 1. Median satellite resolvable water area (km2) for 2017-2020 at a 300-m2 spatial resolution. Below each lake is number of resolvable lakes included in the study. Graphic from Schaeffer et al. 2022.
The map uses five shades of blue to represent five water area ranges in a legend titled “Water area (km²)”:
– 10001 to 15001 (Darkest blue): Minnesota (MN with 393).
– 5001 to 10000 (Dark blue): Maine (ME with 185), Texas (TX with 136), Florida (FL with 133), Wisconsin (WI with 128), Michigan (MI with 128), Louisiana (LA with 92), and California (CA with 90).
– 10001 to 5000 (Medium blue): Includes Washington (WA with 51), North Dakota (ND with 69), South Dakota (SD with 71), Oklahoma (OK with 51), North Carolina (NC with 30), and New York (NY with 72).
– 501 to 1000 (Light blue): Includes Montana (MT with 47), Wyoming (WY with 44), Colorado (CO with 50), Nebraska (NE with 23), Kansas (KS with 28), Arkansas (AR with 29), Tennessee (TN with 26), Alabama (AL with 15), Mississippi (MS with 18), Georgia (GA with 15), South Carolina (SC with 17), Idaho (ID with 34), Utah (UT with 24), and Vermont (VT with 18).
– 1 to 500 (Pale blue/grey): States with smaller values including Iowa (IA with 12), Illinois (IL with 20), Indiana (IN with 15), Ohio (OH with 18), Pennsylvania (PA with 11), New Jersey (NJ with 8), Connecticut (CT with 3), Rhode Island (RI with 5), Massachusetts (MA with 13), New Hampshire (NH with 23), Missouri (MO with 13), Kentucky (KY with 7), Virginia (VA with 8), Maryland (MD with 4), Nevada (NV with 11), New Mexico (NM with 14), and Arizona (AZ with 10). West Virginia (WV) and Delaware (DE) both show a value of 0.
The monthly mean cyanoHAB spatial extent for the nation was 30.7% between 2017 and 2020 and increased over that time period by 6.9%. In contrast, between 2008 and 2011, spatial extent decreased by -0.7%. During both time periods, maximum cyanoHAB spatial extent generally occurred during summer months, with a decrease in the late fall, followed by a smaller peak in the late winter or spring.
Nine regions were defined based on climatology (Figure 2). Between 2017 and 2020, all regions increased cyanoHAB spatial extent although the strength of change varied with greatest increases in the South and Southeast regions (8.6% and 10.9% respectively). Between 2008 and 2011, negligible change was experienced in all regions, apart from the Southwest where spatial extent declined by -4.5%.
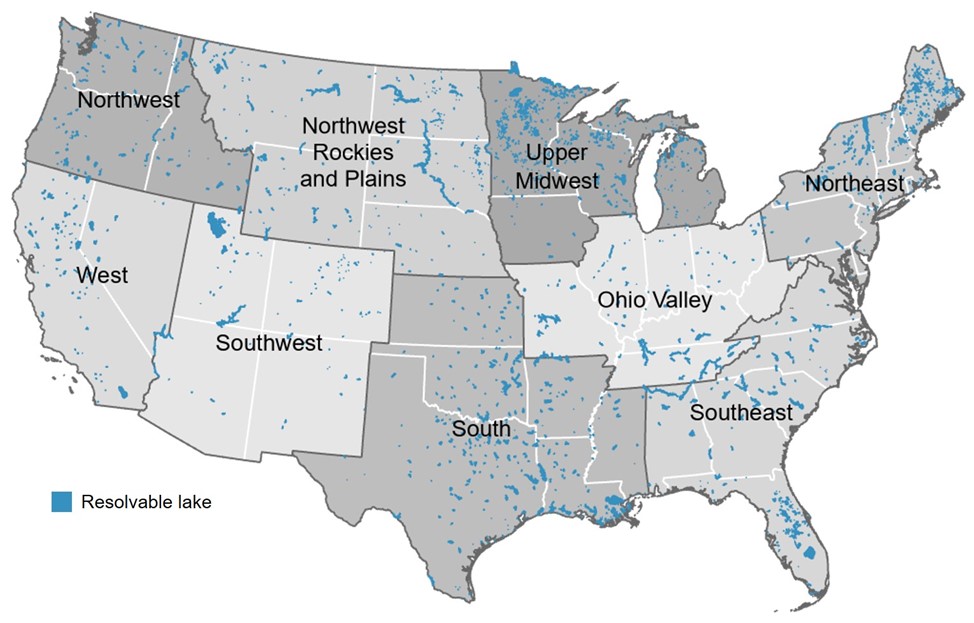
Figure 2. Nine study regions. Graphic from Schaeffer et al. 2022.
A legend in the bottom-left corner features a blue square labeled “Resolvable lake”.
The nine labeled regions show varying densities of these lakes:
– Northwest: Covers Washington, Oregon, and Idaho.
– West: Covers California and Nevada.
– Southwest: Covers Utah, Arizona, Colorado, and New Mexico.
– Northwest Rockies and Plains: Covers Montana, Wyoming, North Dakota, South Dakota, and Nebraska.
– South: Covers Kansas, Oklahoma, Texas, Arkansas, and Louisiana, showing a moderate density of lakes scattered throughout.
– Upper Midwest: Covers Minnesota, Iowa, Missouri, Wisconsin, Illinois, and Michigan, displaying an extremely high concentration of blue lakes, particularly clustered in Minnesota and Wisconsin.
– Ohio Valley: Covers Indiana, Ohio, Kentucky, Tennessee, West Virginia, and Pennsylvania.
– Southeast: Covers Mississippi, Alabama, Georgia, South Carolina, North Carolina, and Florida, with a notably heavy concentration of blue lakes clustered throughout the Florida peninsula.
– Northeast: Covers Virginia, Maryland, Delaware, New Jersey, New York, Connecticut, Rhode Island, Massachusetts, Vermont, New Hampshire, and Maine, with a high concentration of lakes visible in the northernmost states like Maine.
At the state-scale, median cyanoHAB spatial extent percentages were binned into the following four categories: 0-25%, >25-50%, >50-75%, and >75-100%. During 2017-2020, as seen in Figure 3, no state had median cyanoHAB extents greater than 75% (6 states were greater than 75% between 2008 and 2011). Eight states had median extents equal to or greater than 50%, and 26 states had median extents below 25% (5 states below 25% between 2008 and 2011). During the 2017-2020 period, strong increases in monthly spatial extent were observed in New Jersey and Louisiana. Maine exhibited a decrease in cyanoHAB during 2008-2011; however, greater than 75% of its resolvable water area had cyanoHABs detected during the same period. This highlights an important study finding – that a decrease or lack of change in cyanoHAB spatial extent does not necessarily correspond to a lack of cyanoHAB concern.
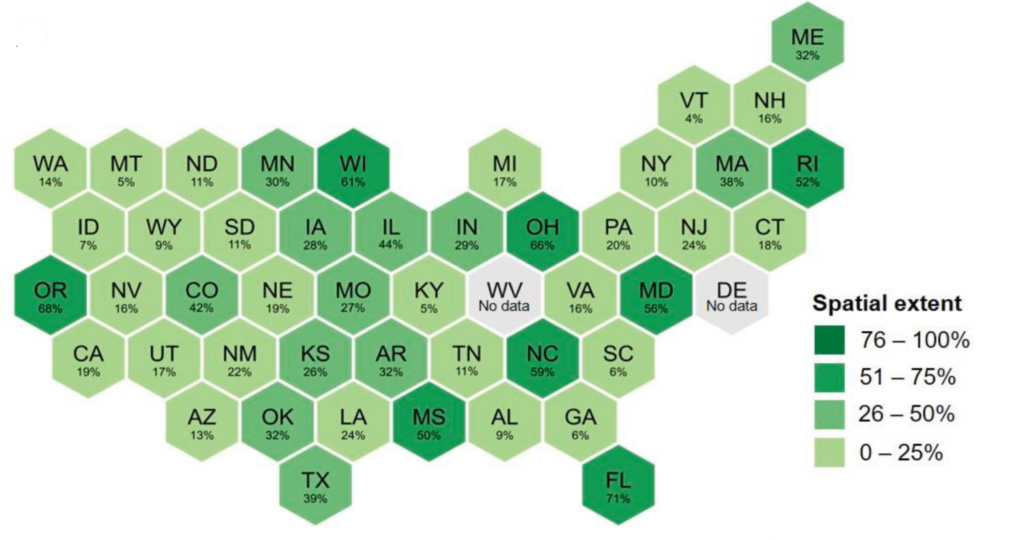
Figure 3. Median spatial extent for each state for 2017-2020. Graphic from Schaeffer et al. 2022.
The map uses four shades of green to represent four percentage ranges in a legend titled “Spatial extent”, plus a white tier for missing data:
– 76 to 100% (Darkest green): No states fall into this highest percentage tier.
– 51 to 75% (Dark green): States include Wisconsin (WI with 61%), Oregon (OR with 68%), Ohio (OH with 66%), Maryland (MD with 56%), Rhode Island (RI with 52%), North Carolina (NC with 59%), and Florida (FL with 71%).
– 26 to 50% (Medium green): States include Minnesota (MN with 30%), Iowa (IA with 28%), Illinois (IL with 44%), Indiana (IN with 29%), Colorado (CO with 42%), Missouri (MO with 27%), Kansas (KS with 26%), Arkansas (AR with 32%), Oklahoma (OK with 32%), Texas (TX with 39%), Mississippi (MS with 50%), Maine (ME with 32%), and Massachusetts (MA with 38%).
– 0 to 25% (Light green): States include Washington (WA with 14%), Montana (MT with 5%), North Dakota (ND with 11%), Idaho (ID with 7%), Wyoming (WY with 9%), South Dakota (SD with 11%), Nebraska (NE with 19%), Nevada (NV with 16%), Utah (UT with 17%), California (CA with 19%), Arizona (AZ with 13%), New Mexico (NM with 22%), Michigan (MI with 17%), Kentucky (KY with 5%), Tennessee (TN with 11%), Louisiana (LA with 24%), Alabama (AL with 9%), Georgia (GA with 6%), South Carolina (SC with 6%), Virginia (VA with 16%), Pennsylvania (PA with 20%), New York (NY with 10%), Vermont (VT with 4%), New Hampshire (NH with 16%), New Jersey (NJ with 24%), and Connecticut (CT with 18%).
– No data (White): West Virginia (WV) and Delaware (DE) are shaded white and labeled “No data”.
All resolvable lakes were independently quantified for spatial extent during the two time periods for the four spatial extent percentage categories used previously. During both time periods, the number of lakes in the lowest spatial extent category (0-25%) decreased and the number of lakes in the upper category (>75-100%) increased. Counts in the middle two categories increased during 2017-2020 but were relatively constant during 2008-2011.
The paper’s findings, some of which were presented here, are an important step in understanding if and where cyanoHABs are increasing, decreasing, or remaining constant across different geographic scales. The methods, employed by the authors, provides each state with a uniform approach for assessing cyanoHAB spatial extent over time via operational satellites. Applying a standard assessment method across space and time may aid in the prioritization of resources, and information on location and extent may inform routine monitoring and management of recreational and drinking water quality and ecosystem health at meaningful geographic scales.
As a final note, future efforts, could apply the approach used in this study to different satellites/sensors with higher spatial resolution and new algorithms, thus expanding the number of lakes examined.
And don’t forget, so much more can be learned by reading the full paper here.
Citation:
Schaeffer, Blake A., Erin Urguhart, Megan Coffer, Wilson Salls, Richard P. Stumpf, Keith A. Loftin, P. Jeremy Werdell. (2022) Satellites quantify the spatial extent of cyanobacterial blooms across the United States at multiple scales. Ecological indicators 140 108990. https://doi.org/10.1016/j.ecolind.2022.108990